Which Neighborhoods in Boston Have the Most Rats?

By Lilly Milman
Sep 17, 2024
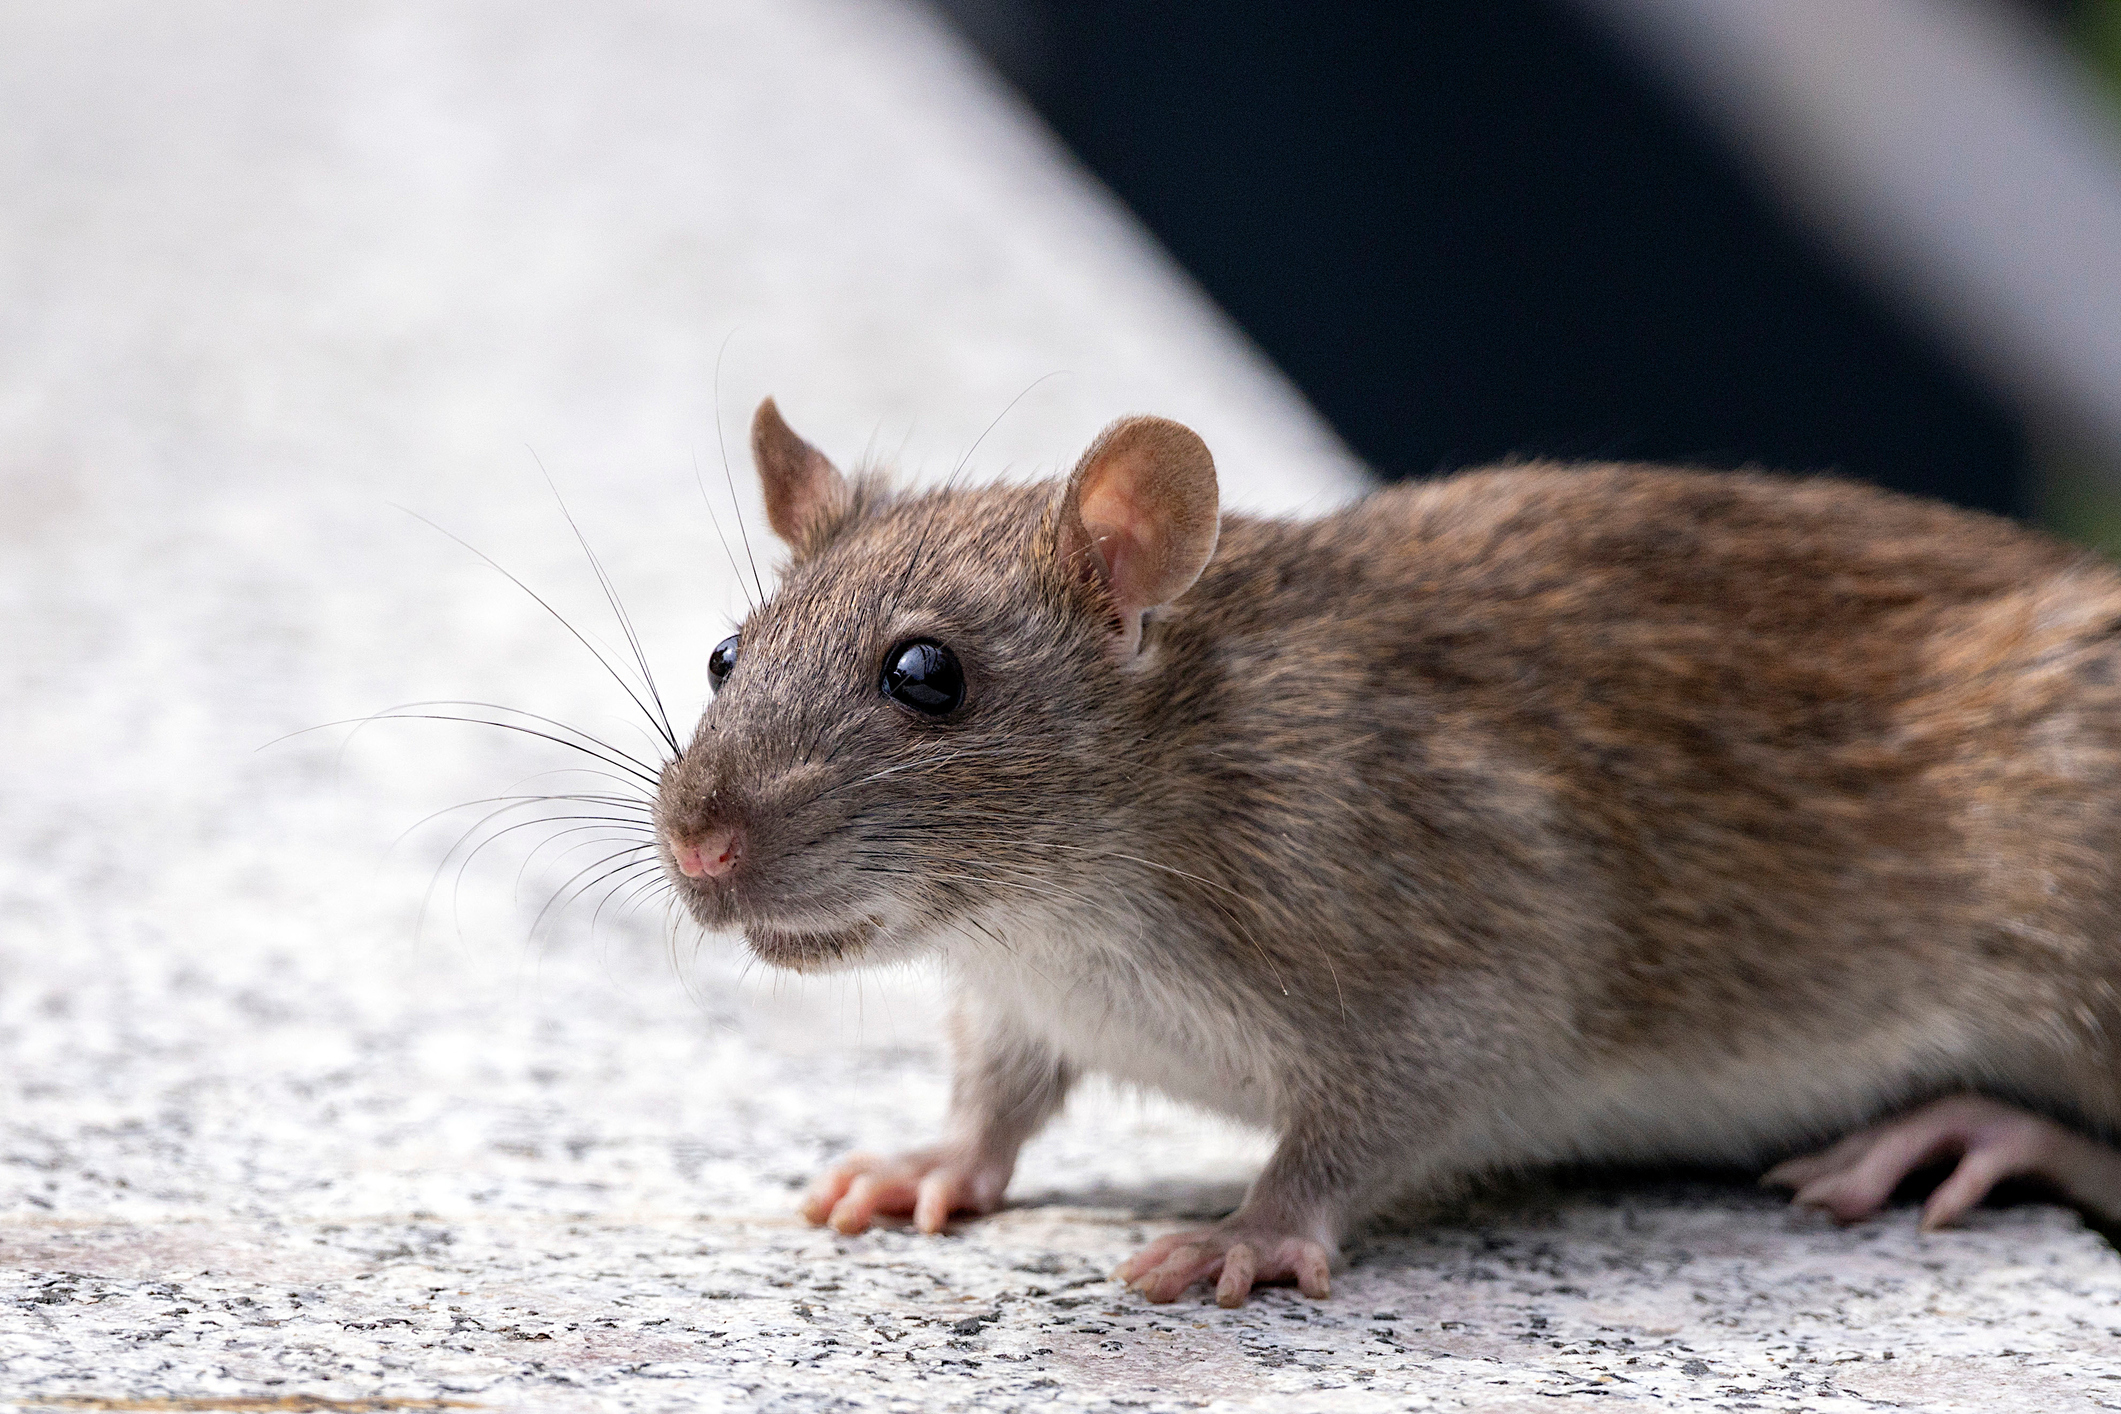
Like most cities, Boston has a bit of a rat problem. If you’ve rented in the city, you’ve probably encountered a few — whether they scurried across the street on your walk home, jumped out of a garbage bin on trash day, or taken up an unfortunate residence in your apartment. There are preventative measures you can take to try to keep them out of your home — like keeping your space clean and free of crumbs or food scraps — but not much you can do about them lurking outside. The City of Boston recently considered creating a “rat czar” position, following in the footsteps of New York City, to deal with the high rodent population. A rodent action plan is available on the city’s official website.
While this new era of rodent control in Boston is still in its early stages, we wanted to figure out exactly where the rodents are congregating in one of the “rattiest cities in America” — and how much they’re paying in rent. The findings may surprise you.
In this report, we data from Boston's 311 service to measure rat incidents per capita as well as our own rental data to find the relationship between rent prices and rat populations. To see the full list of neighborhoods and their respective rat incidents per capita, click here. To learn more about how we completed this study, read our full methodology at the bottom of the page.
What Are the Most Rat-Dense Neighborhoods in Boston?
Below are the five neighborhoods with the highest number of rodent incidents per capita in Boston.
| Neighborhood | Rodent Incident Count | Rodent Incidents Per Capita | Median Rent - 1BR |
|---|---|---|---|
| Back Bay | 163 | 0.00896 | $3,166 |
| South End | 237 | 0.00767 | $3,406 |
| Mattapan | 162 | 0.0068 | $2,100 |
| West End | 52 | 0.00675 | $3,720 |
| Downtown | 92 | 0.00668 | $3,724 |
So, Rat City is Not the Most Rat-Dense Neighborhood in Boston…
While Allston is nicknamed “Rat City,” it did not take the prize for most rodent complaints (which includes 311 reports of “rodent activity,” “mice infestation – residential,” and “rat bites”) per capita in Boston — not even close.
Allston–Brighton and Dorchester may have had the second and first highest counts of rodent incidents in 2024 (457 and 504, respectively), but because these are two of the biggest neighborhoods in Boston, the rodent incidents per capita were relatively low.
It was actually Back Bay, a ritzy downtown neighborhood known for its historic (and expensive) brownstones, that ended up on top of our list of most rat-dense neighborhoods in Boston. It was closely followed by its neighbor, the South End. Out of 21 neighborhoods that we looked at, Back Bay has the third smallest population in Boston (and South End, the seventh smallest), which partially explains the higher number of incidents per capita. The West End and Downtown, similarly expensive and small neighborhoods, also cracked the top five.
Of the top 10 neighborhoods on our list, six have one-bedroom rent prices equal to or above the median rent for Boston ($2,700 as of the end of August ‘24).
The neighborhoods with the lowest number of rodent incidents per capita were Fenway, Hyde Park, West Roxbury, and Roslindale.
Receive monthly data drops like this in your inbox with our newsletter.
Subscribe on LinkedInWhy Do More Expensive Neighborhoods Tend to Have More Rodent Incidents?
One trend that emerged in our data is that more expensive neighborhoods tend to have more reports of rat incidents. This doesn’t necessarily mean these areas have higher rat populations outright — just that more Bostonians in those neighborhoods have taken the time to dial 311 to report one of these rodent incidents.
According to one study done in 2017 by New York University, those who live in higher-income neighborhoods are more likely to call 311 than those in lower-income neighborhoods. So, it may be the case that those living in more expensive neighborhoods are more likely to call in a 311 report on rodent activity. Meanwhile, in a neighborhood like Fenway where most of the population are young student renters coming in from out of town, residents may be less likely to report rodent sightings. It’s also worth noting that the median age of Back Bay’s residents is around 36 years old and the median age of Fenway residents is closer to 25 — and Gen Z and younger adults commonly express feeling “phone anxiety” around making or receiving calls.
Another potential explanation is simply location. The closer a neighborhood is to downtown Boston, the more expensive it is. However, city centers are also where rats tend to congregate because there are so many people (and subsequently, a lot of restaurants, foot traffic, and food sources). So, it’s not surprising that there’s also a high density of rodent problems in downtown-adjacent neighborhoods.
Below is the full list of neighborhoods in Boston, their rent prices, and their rodent incidents per capita.
Boston Neighborhoods and Their Rat Incidents Per Capita
| Neighborhood | Rodent Incident Count | Rodent Incidents Per Capita | Median Rent - 1BR |
|---|---|---|---|
| Back Bay | 163 | 0.00896 | $3,166 |
| South End | 237 | 0.00767 | $3,406 |
| Mattapan | 162 | 0.0068 | $2,100 |
| West End | 52 | 0.00675 | $3,720 |
| Downtown | 92 | 0.00668 | $3,724 |
| North End | 72 | 0.00666 | $2,600 |
| Roxbury | 336 | 0.00616 | $2,700 |
| Allston–Brighton | 457 | 0.00594 | $2,380 |
| Seaport | 33 | 0.00592 | $3,997 |
| South Boston | 223 | 0.00588 | $2,889 |
| Jamaica Plain | 231 | 0.00577 | $2,746 |
| Beacon Hill | 53 | 0.00568 | $2,909 |
| Charlestown | 84 | 0.00439 | $2,790 |
| East Boston | 187 | 0.00434 | $2,550 |
| Dorchester | 504 | 0.00412 | $2,500 |
| Mission Hill | 72 | 0.00411 | $2,467 |
| Roslindale | 121 | 0.00409 | $2,200 |
| West Roxbury | 99 | 0.00314 | $2,315 |
| Hyde Park | 106 | 0.0031 | $1,988 |
| Fenway | 48 | 0.00112 | $2,900 |
For this study, ApartmentAdvisor analyzed all 311 reports of “rodent activity,” “mice infestation – residential,” and “rat bites” made in Boston during 2024 as well as listings available on its platform across 21 Boston neighborhoods for which there was sufficient data. To determine which neighborhoods had the highest density of rodent activity, ApartmentAdvisor used population data from the U.S. Census to calculate rodent incidents per capita.
Top cities
Atlanta Apartments
1,746 apartments starting at $700/month
Austin Apartments
6,436 apartments starting at $600/month
Baltimore Apartments
1,375 apartments starting at $475/month
Boston Apartments
5,652 apartments starting at $980/month
Charlotte Apartments
3,114 apartments starting at $560/month
Chicago Apartments
6,633 apartments starting at $638/month
Dallas Apartments
5,770 apartments starting at $595/month
Fort Worth Apartments
2,675 apartments starting at $500/month
Houston Apartments
5,614 apartments starting at $596/month
Las Vegas Apartments
1,069 apartments starting at $650/month
Los Angeles Apartments
11,357 apartments starting at $700/month
Miami Apartments
598 apartments starting at $1,100/month
Milwaukee Apartments
1,240 apartments starting at $595/month
New York Apartments
4,581 apartments starting at $600/month
Oakland Apartments
834 apartments starting at $850/month
Orlando Apartments
854 apartments starting at $940/month
Philadelphia Apartments
3,293 apartments starting at $500/month
Phoenix Apartments
4,259 apartments starting at $611/month
Pittsburgh Apartments
878 apartments starting at $450/month
Portland Apartments
2,228 apartments starting at $750/month
Raleigh Apartments
1,224 apartments starting at $550/month
San Antonio Apartments
3,607 apartments starting at $495/month
San Diego Apartments
2,818 apartments starting at $650/month
San Francisco Apartments
565 apartments starting at $830/month
San Jose Apartments
406 apartments starting at $1,100/month
Seattle Apartments
3,594 apartments starting at $650/month
Tampa Apartments
816 apartments starting at $812/month
Washington DC Apartments
2,372 apartments starting at $898/month


