Boston Rent Report: What Are the Hottest Neighborhoods in Boston?

By Lilly Milman
Dec 18, 2023
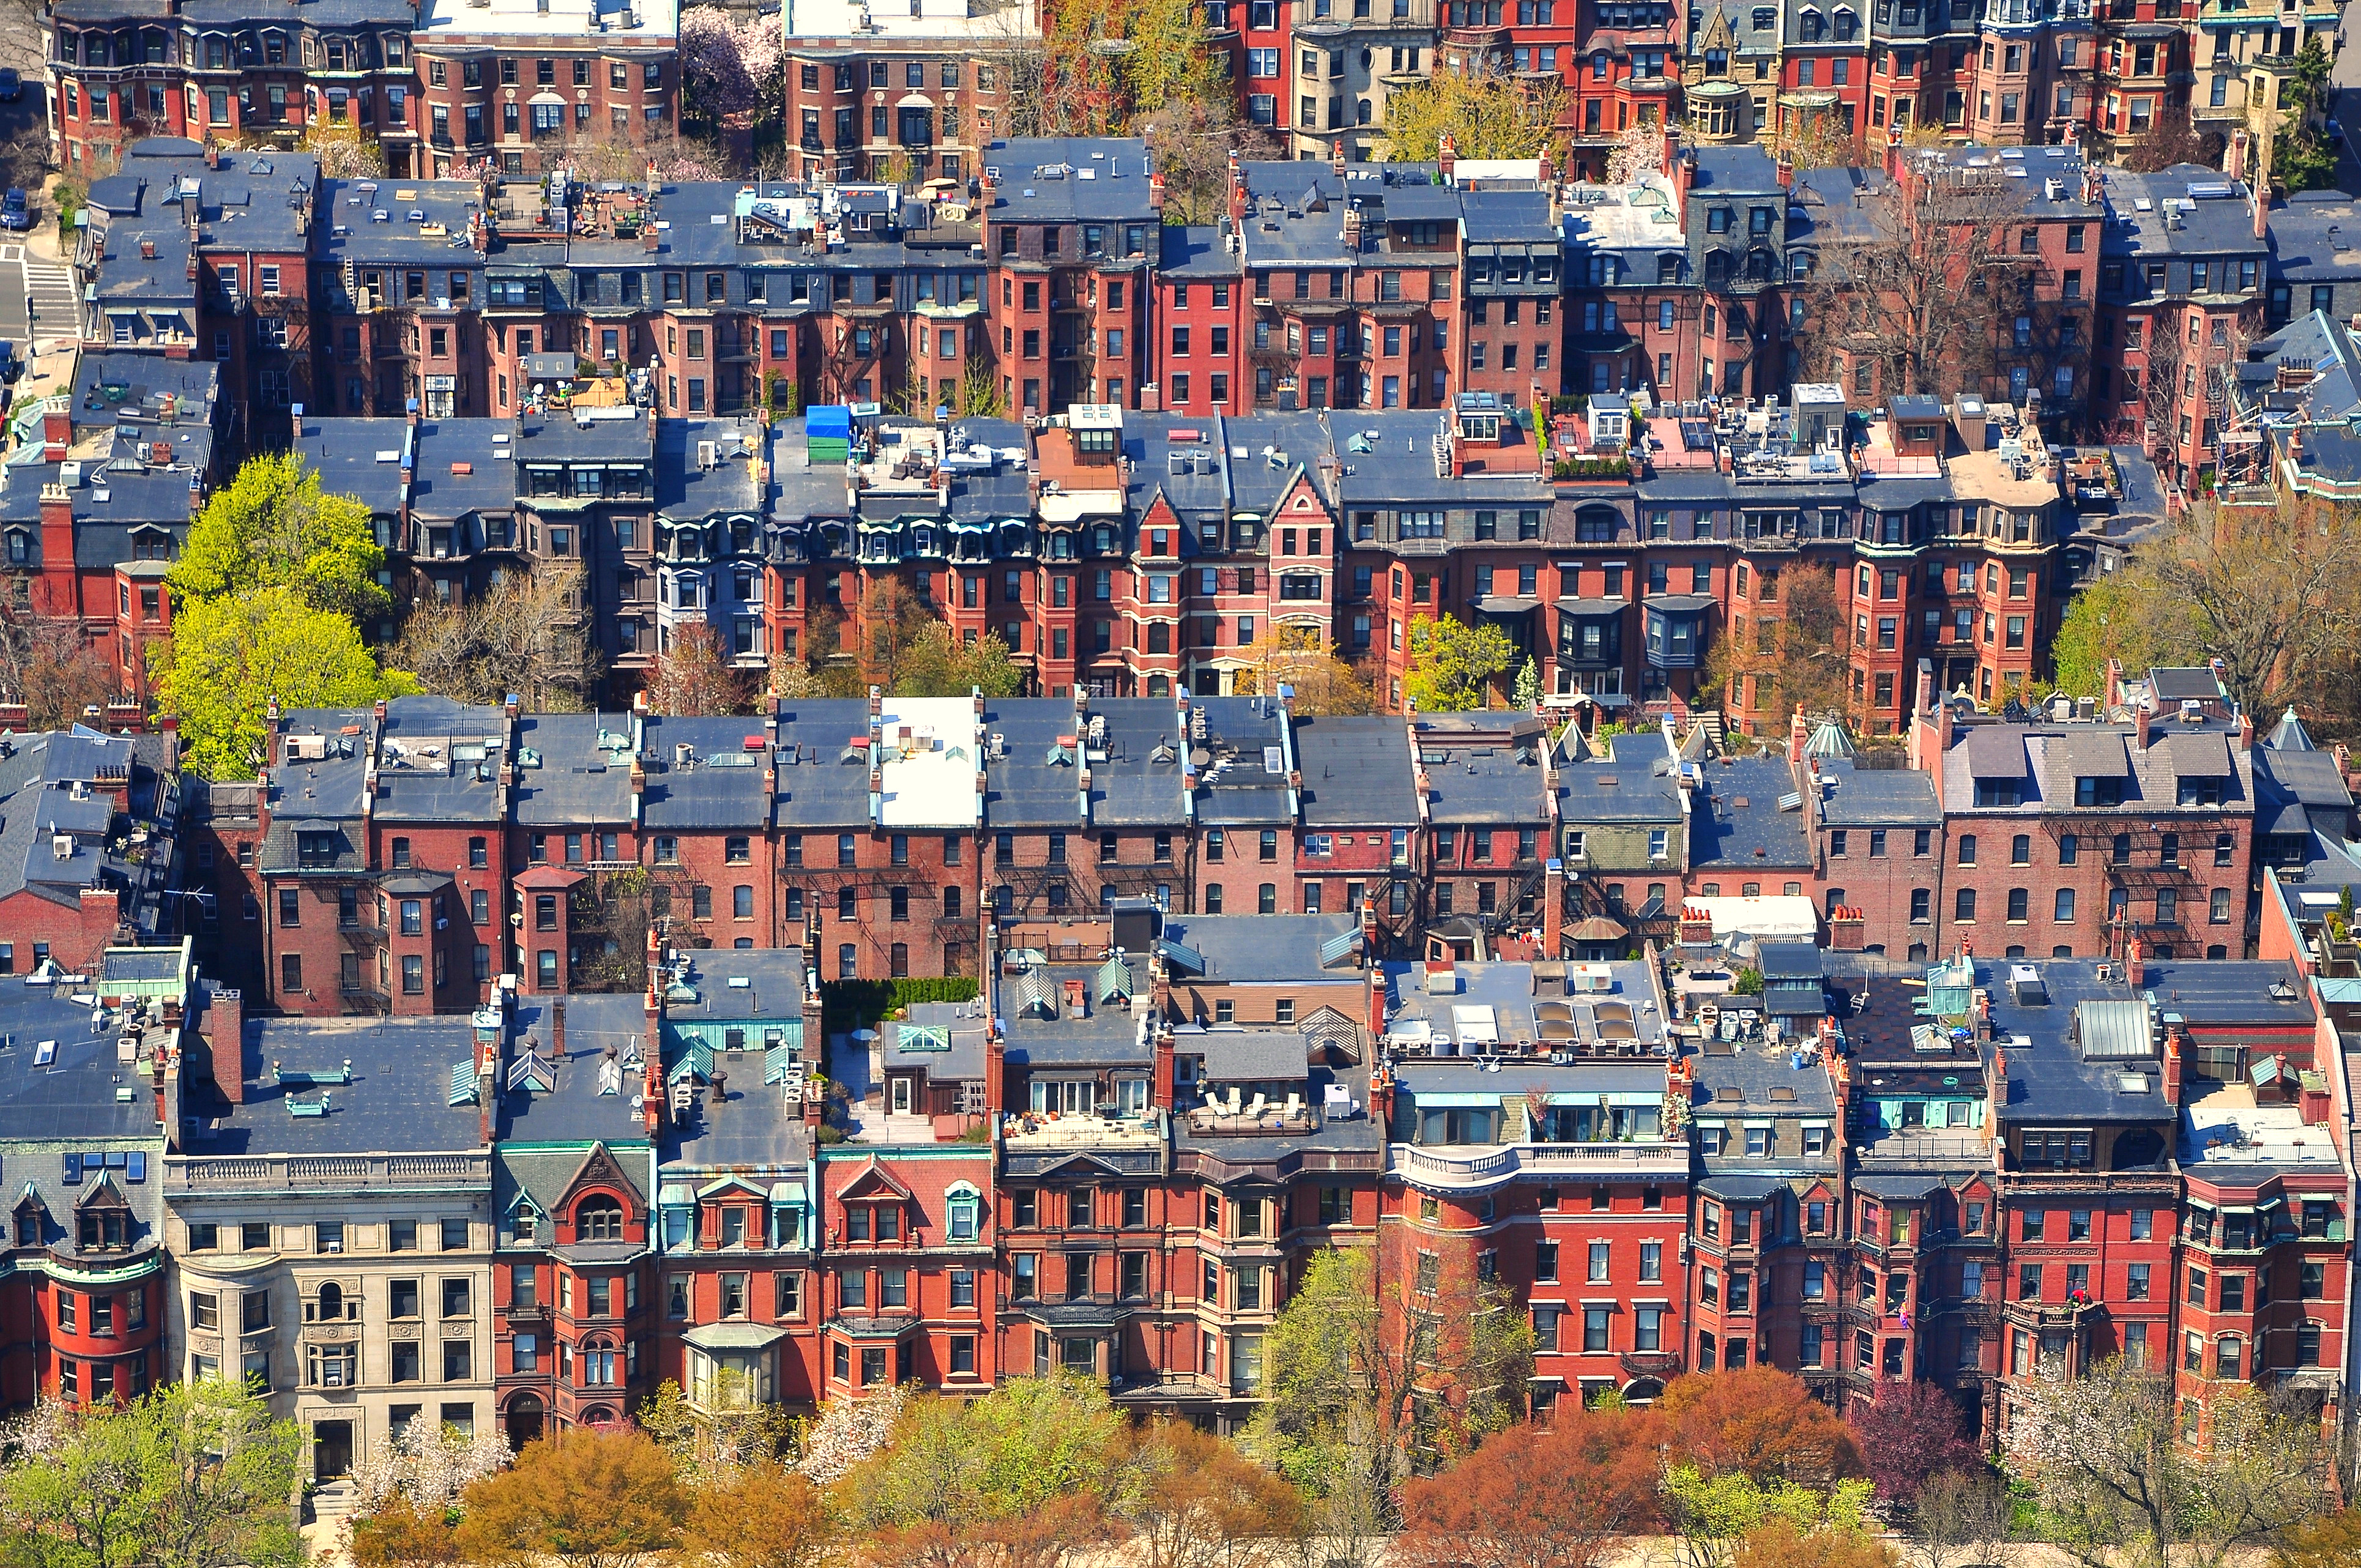
While rent prices cool across the nation, Boston renters seem to be out of luck. A lack of new residential construction and a high demand for housing — driven by the annual population increase in the city as well as the large number of students that move into town for school each year — have squeezed the rental market, increasing prices across neighborhoods.
In this report, we provide an overview of where renters are most likely to get more space for their money and where costs have increased the most across the city.
Receive monthly data drops like this in your inbox with our newsletter.
Subscribe on LinkedInRenting in Boston: Challenges and Opportunities
Residential living space comes at a premium in Boston, with an overall median rent per square foot of $4.63, and this makes finding an affordable apartment a challenge for many budget-conscious renters.
However, among Boston’s neighborhoods, there is substantial variation in the cost of space, and for renters willing to expand their search, it is possible to find units where you get much more bang for your buck. At $5.85 per square foot, the median cost is most expensive in Boston’s Seaport neighborhood. Meanwhile, less than three miles away in Charlestown (which also sports water views) the cost per square foot runs closer to $3.73. The lowest median cost per square is found in Roslindale, at only $2.52 per square foot.
| Neighborhood | Median Cost Per Square Foot |
|---|---|
| Roslindale | $ 2.52 |
| Roxbury | $ 2.64 |
| Medford | $ 2.67 |
| West Roxbury | $ 2.73 |
| Dorchester | $ 2.80 |
| Somerville | $ 3.00 |
| East Boston | $ 3.32 |
| Jamaica Plain | $ 3.40 |
| Central Square | $ 3.44 |
| Charlestown | $ 3.73 |
| Brookline | $ 3.78 |
| South Boston | $ 3.79 |
| Brighton | $ 3.83 |
| Allston | $ 4.00 |
| Mission Hill | $ 4.18 |
| Downtown | $ 4.67 |
| North End | $ 4.69 |
| Kendall Square | $ 4.86 |
| Beacon Hill | $ 5.04 |
| South End | $ 5.10 |
| Fenway | $ 5.19 |
| Back Bay | $ 5.19 |
| Harvard Square | $ 5.35 |
| Seaport | $ 5.85 |
What’s the Price of a One-Bedroom Apartment in Boston?
Over the years, it has become more and more costly for renters to get a one-bedroom apartment in the Boston area. Two years ago, there were nine neighborhoods in Greater Boston where the median monthly rent price was below $2,000 during the peak rental season, which occurs between April and September, according to our data. Last year, this figure decreased to just one neighborhood — Roslindale. This past summer, there were no neighborhoods in Greater Boston where one could rent a one-bedroom apartment for less than $2,000 a month.
| Neighborhood or City | Median Rent Price (1BR) 2021 | Median Rent Price (1BR) 2022 | Median Rent Price (1BR) 2023 |
|---|---|---|---|
| West Roxbury | $1,855 | $2,228 | $2,150 |
| Brighton | $1,819 | $2,050 | $2,238 |
| Allston | $1,785 | $2,050 | $2,250 |
| Roslindale | $1,850 | $1,950 | $2,300 |
| East Boston | $2,000 | $2,100 | $2,300 |
| Roxbury | $1,985 | $2,100 | $2,338 |
| Mission Hill | $1,700 | $2,000 | $2,395 |
| Medford | $1,750 | $2,100 | $2,398 |
| North End | $2,059 | $2,400 | $2,500 |
| Jamaica Plain | $1,900 | $2,408 | $2,500 |
| Somerville | $2,000 | $2,275 | $2,532 |
| Boston | $2,200 | $2,500 | $2,600 |
| Charlestown | $2,500 | $2,750 | $2,695 |
| Brookline | $2,200 | $2,590 | $2,700 |
| Beacon Hill | $2,350 | $2,600 | $2,745 |
| Central Square | $2,300 | $2,754 | $2,762 |
| Harvard Square | $2,400 | $2,625 | $2,800 |
| Dorchester | $1,950 | $2,350 | $2,852 |
| Cambridge | $2,450 | $2,752 | $2,874 |
| Fenway | $2,350 | $2,650 | $2,900 |
| South Boston | $2,930 | $3,000 | $2,988 |
| Back Bay | $2,650 | $3,000 | $3,085 |
| South End | $2,950 | $3,245 | $3,346 |
| Kendall Square | $3,472 | $3,626 | $3,791 |
| Downtown | $3,219 | $3,654 | $3,813 |
| Seaport | $3,307 | $3,811 | $4,195 |
As of the end of November, the monthly rent price of a one-bedroom Boston apartment cooled off in many neighborhoods — but Back Bay, Beacon Hill, Charlestown, East Boston, Jamaica Plain, Mission Hill, the North End, and West Roxbury actually saw increases, despite peak rental season ending. Prices rose between the end of August and the end of November in nearby Somerville as well.
| Neighborhood or City | Median Rent Price (1BR) Aug 23 | Median Rent Price (1BR) Nov 23 |
|---|---|---|
| West Roxbury | $2,111 | $2,138 |
| Roxbury | $2,400 | $2,200 |
| Allston | $2,317 | $2,300 |
| Roslindale | $2,420 | $2,373 |
| Brighton | $2,300 | $2,439 |
| Mission Hill | $2,306 | $2,514 |
| East Boston | $2,416 | $2,575 |
| Somerville | $2,550 | $2,695 |
| Medford | $2,800 | $2,700 |
| Dorchester | $2,878 | $2,702 |
| North End | $2,650 | $2,850 |
| Harvard Square | $2,950 | $2,850 |
| Central Square | $2,950 | $2,945 |
| Boston | $2,800 | $2,951 |
| Cambridge | $3,000 | $2,975 |
| Fenway | $3,052 | $3,000 |
| Beacon Hill | $2,750 | $3,000 |
| Jamaica Plain | $2,500 | $3,020 |
| Brookline | $2,800 | $3,045 |
| South Boston | $3,200 | $3,100 |
| Charlestown | $2,900 | $3,240 |
| South End | $3,517 | $3,400 |
| Kendall Square | $3,821 | $3,627 |
| Back Bay | $3,200 | $3,672 |
| Downtown | $3,883 | $3,702 |
| Seaport | $4,350 | $3,918 |
What are the Hottest Neighborhoods in Boston?
Despite this seasonal cooling, there are a few neighborhoods in Boston that stand out for their exponential rent growth year over year.
While nearly every neighborhood that we looked at in Greater Boston experienced significant rent growth between 2021 and 2022 due to pandemic-induced rent inflation, most saw significantly slower growth over the following year. For example, between 2021 and 2022, the median rental price for a one-bedroom apartment in Jamaica Plain grew by 26.8%. However, between 2022 and 2023, it only grew by 3.8%. When looking at the entire city of Boston, rent grew by 13.6% between 2021 and 2022 — and only by 4% the following year.
On the other end of the spectrum are the neighborhoods that saw even greater increases this past year, bucking the citywide trend. Between 2021 and 2022, Dorchester saw a rent hike of 20.5% — then another of 21.4% between 2022 and 2023. Mission Hill also saw a greater rent increase between 2022 and 2023 (19.8%) than it did during the previous period (17.6%). And Roslindale, which has one of the lowest median prices for rent on our list, saw its rent explode between 2022 and 2023, increasing by 17.9%, despite only seeing a small increase of 5.4% between 2021 and 2022.
It is in these once affordable pockets that rent is increasing the fastest in the city, while historically pricy areas like Kendall Square in Cambridge are seeing much slower rent increases.
| Neighborhood or City | % Change in Rent YoY (21–22) | % Change in Rent YoY (22–23) |
|---|---|---|
| West Roxbury | 20.1 | -3.5 |
| Charlestown | 10 | -2 |
| South Boston | 2.39 | -0.42 |
| Central Square | 19.7 | 0.301 |
| Back Bay | 13.2 | 2.84 |
| South End | 10 | 3.1 |
| Jamaica Plain | 26.8 | 3.8 |
| Boston | 13.6 | 4 |
| North End | 16.6 | 4.17 |
| Brookline | 17.7 | 4.25 |
| Downtown | 13.5 | 4.33 |
| Cambridge | 12.3 | 4.43 |
| Kendall Square | 4.45 | 4.56 |
| Beacon Hill | 10.6 | 5.57 |
| Harvard Square | 9.38 | 6.67 |
| Brighton | 12.7 | 9.15 |
| Fenway | 12.8 | 9.43 |
| East Boston | 5 | 9.52 |
| Allston | 14.8 | 9.76 |
| Seaport | 15.2 | 10.1 |
| Somerville | 13.8 | 11.3 |
| Roxbury | 5.79 | 11.3 |
| Medford | 20 | 14.2 |
| Roslindale | 5.41 | 17.9 |
| Mission Hill | 17.6 | 19.8 |
| Dorchester | 20.5 | 21.4 |
Methodology
For this study, ApartmentAdvisor analyzed listings available on its platform in the Boston neighborhoods for which we had sufficient inventory. Rent prices and cost per square footage calculations were based on median rents. The change in rent price calculations were based on aggerated median rents for one-bedroom apartments during the peak rental season months of April through September in 2021, 2022, and 2023.
For a look at average rent prices at the state level, refer to our Massachusetts Rent Report, published monthly. ApartmentAdvisor also publishes a Boston market report that breaks down rental market trends, which is updated daily.
Press contact: Amy Mueller (pr@apartmentadvisor.com)


Top cities
Atlanta Apartments
1,825 apartments starting at $630/month
Austin Apartments
6,133 apartments starting at $600/month
Baltimore Apartments
1,423 apartments starting at $640/month
Boston Apartments
5,609 apartments starting at $425/month
Charlotte Apartments
2,980 apartments starting at $570/month
Chicago Apartments
5,458 apartments starting at $400/month
Dallas Apartments
5,455 apartments starting at $625/month
Fort Worth Apartments
2,695 apartments starting at $695/month
Houston Apartments
5,813 apartments starting at $450/month
Las Vegas Apartments
1,016 apartments starting at $795/month
Los Angeles Apartments
12,712 apartments starting at $750/month
Miami Apartments
702 apartments starting at $1,200/month
Milwaukee Apartments
1,106 apartments starting at $475/month
New York Apartments
8,874 apartments starting at $600/month
Oakland Apartments
983 apartments starting at $850/month
Orlando Apartments
877 apartments starting at $895/month
Philadelphia Apartments
3,614 apartments starting at $500/month
Phoenix Apartments
3,461 apartments starting at $592/month
Pittsburgh Apartments
1,382 apartments starting at $590/month
Portland Apartments
2,260 apartments starting at $575/month
Raleigh Apartments
1,471 apartments starting at $550/month
San Antonio Apartments
3,372 apartments starting at $525/month
San Diego Apartments
2,860 apartments starting at $650/month
San Francisco Apartments
664 apartments starting at $500/month
San Jose Apartments
516 apartments starting at $1,000/month
Seattle Apartments
3,520 apartments starting at $452/month
Tampa Apartments
776 apartments starting at $808/month
Washington DC Apartments
2,256 apartments starting at $910/month